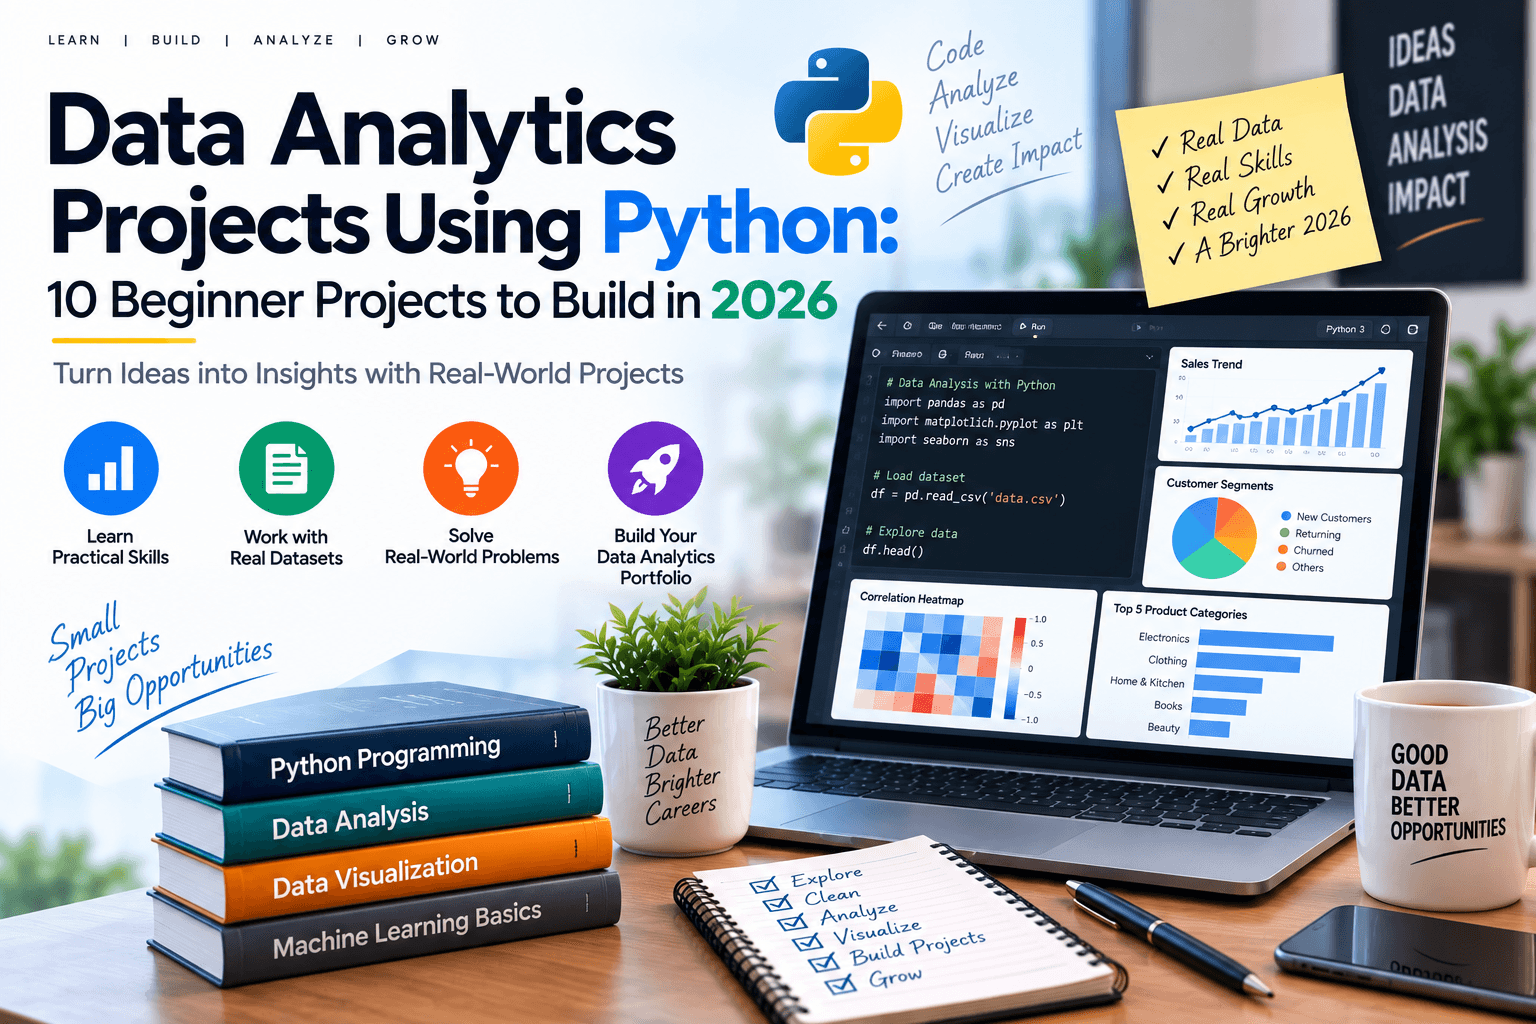
Data Analytics Projects Using Python: 10 Beginner Projects to Build in 2026
By Sadhvi Academy
Introduction
Learning Python is an important step for students and beginners who want to build practical Data Analytics skills. However, simply learning Python syntax, functions and libraries is not enough.
To become confident with Python for Data Analysis, you need to apply what you learn to real datasets and business problems.
This is where Python data analytics projects become valuable.
A project gives you an opportunity to work through the complete data analysis process:
Raw Data → Data Cleaning → Data Exploration → Analysis → Visualization → Insights → Business Recommendations
Python libraries such as Pandas provide tools for working with tabular data, filtering and selecting data, calculating statistics, combining datasets and creating visualizations.
For beginners, the best projects are not necessarily the most complicated ones. A good project should help you demonstrate that you can understand a dataset, clean it, analyze meaningful questions and communicate the results clearly.
In this guide, we will explore 10 Python data analytics projects for beginners in 2026, what each project involves, which Python skills you can practice and what you can include in your portfolio.
What Are Python Data Analytics Projects?
Python data analytics projects are practical projects where Python is used to collect, clean, transform, analyze and visualize data to answer specific questions.
For example, instead of simply learning how to use Pandas, you could use Pandas to analyze:
Marketing campaign performance
Customer churn
Personal expenses
Product reviews
Employee attendance
Movie ratings
Website traffic
Financial transactions
Food delivery data
Retail inventory
The goal is not just to write Python code.
The goal is to use Python to answer a real analytical question.
For example: Which marketing channel generated the highest conversion rate?
Or:
Which product category generated the highest profit?
Or:
Which month had the highest customer churn?
These questions give your project a clear business purpose.
Why Should Beginners Build Python Data Analytics Projects?
Building projects helps beginners move from theoretical learning to practical problem-solving.
A project allows you to practice:
Python programming
Pandas
NumPy
Data cleaning
Data transformation
Data visualization
Exploratory data analysis
Basic statistics
Business analysis
Report preparation
Presentation of insights
It also gives you something concrete to demonstrate when applying for internships or entry-level Data Analyst positions.
The August Python article already introduces Python fundamentals, libraries and the importance of real-world projects. This new article takes the next step by focusing specifically on project execution and portfolio-worthy analysis.
Python Libraries You Should Know for Data Analytics Projects
Before starting these projects, beginners should become familiar with a few important Python libraries.
1. Pandas
Pandas is one of the most important Python libraries for working with tabular data.
It can help you:
Read CSV files
Import Excel data
Filter rows
Select columns
Handle missing data
Group data
Merge datasets
Calculate statistics
Work with dates
Create new columns
Pandas documentation specifically highlights data cleaning, filtering, grouping, reshaping, merging, time-series analysis and visualization as common data-analysis tasks.
Example:
import pandas as pd df = pd.read_csv("sales.csv") print(df.head())
2. NumPy
NumPy is useful for numerical calculations and working with arrays.
For example:
import numpy as np average_sales = np.mean(df["Sales"]) print(average_sales)
Beginners do not need to master every NumPy feature before starting a project. Basic numerical operations are enough for many introductory analytics projects.
3. Matplotlib
Matplotlib can be used to create charts and visualize data.
Example:
import matplotlib.pyplot as plt
plt.bar(df["Category"], df["Sales"]) plt.xlabel("Category") plt.ylabel("Sales") plt.title("Sales by Category") plt.show()
4. Seaborn
Seaborn can help create statistical visualizations with Python. It can be useful for:
Correlation analysis
Distribution plots
Bar charts
Box plots
Heatmaps
If you are completely new to Python, start with our Python for Beginners (2026): Complete Roadmap to Become a Data Analyst guide before moving into these data analytics projects.
10 Python Data Analytics Projects for Beginners in 2026
Now let's look at 10 practical Python projects for Data Analysts.
1. Marketing Campaign Performance Analysis
Project Objective: Analyze marketing campaign data to understand which campaigns and channels generate the best results.
Dataset Can Include
Campaign name
Marketing channel
Impressions
Clicks
Leads
Conversions
Advertising spend
Revenue
Campaign date
Questions You Can Answer
Which campaign generated the most conversions?
Which channel generated the highest revenue?
What is the conversion rate?
Which campaign had the highest return?
How much was spent on each channel?
Which campaign performed below expectations?
Python Skills Used
Pandas
Data cleaning
GroupBy
Aggregation
Percentage calculations
Matplotlib
Seaborn
Example:
campaign_summary = df.groupby("Channel")["Revenue"].sum()
print(campaign_summary) You can then visualize the result using a bar chart.
Portfolio Output
Your final project can include:
Marketing Performance Dashboard with:
Total Spend
Total Leads
Total Conversions
Revenue
Conversion Rate
Best Performing Channel
This project is useful because it connects Python data analysis with a real business use case.
2. Customer Churn Analysis Using Python
Project Objective: Analyze customer data to identify patterns associated with customers leaving a service.
Dataset Can Include
Customer ID
Age
Subscription type
Monthly charges
Tenure
Support calls
Payment method
Churn status
Questions You Can Answer
What percentage of customers churned?
Which subscription type has the highest churn?
Does customer tenure affect churn?
Which age group has higher churn?
Do higher support interactions relate to churn?
Which customer segment has the highest risk?
Python Skills Used
Pandas
Filtering
GroupBy
Data cleaning
Descriptive statistics
Visualization
Example
churn_rate = df["Churn"].value_counts(normalize=True) * 100
print(churn_rate)
You can visualize churn by subscription type:
df.groupby("Subscription")["Churn"].value_counts()
Portfolio Output
Create a report showing:
Overall churn rate
Churn by subscription
Churn by age group
Churn by tenure
Key observations
This is a strong project for demonstrating business-oriented Python analysis.
3. Personal Expense Analysis Using Python
Project Objective: Build a Python project that analyzes personal or household expenses.
This is one of the easiest Python projects for beginners because the dataset is simple to understand.
Dataset Can Include
Date
Category
Description
Amount
Payment method
Questions You Can Answer
What is the total monthly expense?
Which category consumes the most money?
How much is spent on food?
Which month has the highest expenses?
What percentage goes toward each category?
Python Skills Used
CSV handling
Pandas
Date conversion
GroupBy
Aggregation
Visualization
Example
category_expense = df.groupby("Category")["Amount"].sum()
print(category_expense)
You can create:
Monthly expense chart
Category-wise expense chart
Spending trend
Top expense categories
Portfolio Output
Create a simple:
Personal Expense Analysis Report This is a beginner-friendly project that demonstrates the complete data analysis workflow without requiring a complicated dataset.
4. Product Review Sentiment Analysis
Project Objective: Analyze customer product reviews to understand customer opinions and identify common patterns.
Dataset Can Include
Product name
Review
Rating
Review date
Category
Customer ID
Questions You Can Answer
Which products have the highest ratings?
Which categories receive the most negative reviews?
What percentage of reviews are positive?
Which products receive repeated complaints?
What are the most common customer concerns?
Python Skills Used
Pandas
Text cleaning
String operations
Rating analysis
Data visualization
For beginners, you can keep the project simple by using the rating as an indicator of customer satisfaction rather than building a complex machine-learning sentiment model.
Portfolio Output Create:
Product Review Analysis with:
Average rating
Positive vs negative ratings
Top-rated products
Lowest-rated products
Common customer complaints
This project demonstrates how Python can be applied to customer experience data.
5. Employee Attendance and Performance Analysis
Project Objective: Analyze employee attendance and performance data to identify workplace trends.
Dataset Can Include
Employee ID
Department
Attendance days
Leave days
Working hours
Performance score
Experience
Monthly target
Questions You Can Answer
Which department has the highest attendance?
Is attendance different across departments?
Which employees achieved their targets?
Does experience relate to performance?
Which department has the highest average performance?
Python Skills Used
Pandas
Data cleaning
GroupBy
Average calculations
Correlation analysis
Visualization
Example:
department_performance = (
df.groupby("Department")["PerformanceScore"]
.mean()
)
print(department_performance)
Portfolio Output You can create:
Employee Performance Analysis Report with:
Department performance
Attendance trends
Target achievement
Performance distribution
This project introduces beginners to HR analytics using Python without simply repeating the existing general HR project article.
6. Movie Ratings and Viewer Analysis
Project Objective: Analyze movie data to identify trends in ratings, genres and viewer preferences.
Dataset Can Include
Movie title
Genre
Release year
Rating
Number of votes
Duration
Revenue
Questions You Can Answer
Which genre has the highest average rating?
Which movies have the most votes?
How have ratings changed over time?
Which year had the most releases?
Which genre generates the highest average revenue?
Python Skills Used
Pandas
Sorting
GroupBy
Aggregation
Filtering
Data visualization
Example:
genre_rating = (
df.groupby("Genre")["Rating"]
.mean()
.sort_values(ascending=False)
)
print(genre_rating)
Portfolio Output
Build:
Movie Data Analysis Report
with charts showing:
Ratings by genre
Movies by year
Top-rated movies
Revenue trends
Viewer engagement
This is a good beginner project because the subject is familiar while still providing multiple analytical questions.
7. Website Traffic Analysis Using Python
Project Objective: Analyze website traffic to understand how users interact with a website.
Dataset Can Include
Date
Traffic source
Sessions
Users
Page views
Bounce rate
Conversions
Device type
Questions You Can Answer
Which traffic source brings the most visitors?
Which source produces the highest conversions?
Which device has the highest traffic?
Which day or month gets the most visitors?
Which source has the highest conversion rate?
Python Skills Used
Pandas
Date analysis
GroupBy
Aggregation
Conversion calculations
Data visualization
Example
source_summary = df.groupby("Source")[
["Sessions", "Conversions"]
].sum()
print(source_summary)
Portfolio Output Create:
Website Traffic Performance Report
Include:
Traffic by source
Conversion rate
Device analysis
Traffic trends
Top-performing channels
This project can be particularly useful for students interested in Digital Marketing Analytics and Business Analytics.
8. Financial Transaction Analysis
Project Objective: Analyze transaction data to identify spending patterns and financial trends.
Dataset Can Include
Transaction ID
Date
Customer ID
Transaction type
Amount
Category
Payment method
Questions You Can Answer
What is the total transaction value?
Which category has the highest transaction volume?
Which month has the highest transaction amount?
What is the average transaction value?
Which payment method is most frequently used?
Python Skills Used
Pandas
Data cleaning
Date analysis
GroupBy
Statistical analysis
Visualization
Example:
monthly_transactions = (
df.groupby("Month")["Amount"]
.sum()
)
print(monthly_transactions)
Portfolio Output:
Create a financial analysis report showing:
Transaction volume
Transaction value
Monthly trends
Category analysis
Payment method distribution
This project demonstrates how Python can be used to analyze structured financial data.
9. Food Delivery Data Analysis
Project Objective: Analyze food delivery orders to understand customer behavior and restaurant performance.
Dataset Can Include
Order ID
Restaurant
Cuisine
Order value
Delivery time
Customer rating
Location
Order date
Questions You Can Answer
Which cuisine receives the most orders?
Which restaurant generates the highest revenue?
What is the average order value?
Which restaurants have the highest ratings?
Does delivery time affect ratings?
Which locations generate the most orders?
Python Skills Used
Pandas
Data cleaning
GroupBy
Sorting
Correlation
Data visualization
Portfolio Output
Create:
Food Delivery Business Analysis with:
Top restaurants
Popular cuisines
Revenue trends
Average delivery time
Customer ratings
This project is particularly useful for demonstrating how analytics can support operational and customer-experience decisions.
10. Retail Inventory Analysis Using Python
Project Objective: Analyze inventory data to identify stock movement and products that may require attention.
Dataset Can Include
Product ID
Product name
Category
Stock quantity
Units sold
Reorder level
Product price
Supplier
Questions You Can Answer
Which products sell the fastest?
Which products have low stock?
Which categories generate the most sales?
Which products may require restocking?
Which products have low sales despite high inventory?
Python Skills Used
Pandas
Filtering
GroupBy
Conditional logic
Sorting
Visualization
Example:
low_stock = df[
df["StockQuantity"] <= df["ReorderLevel"]
]
print(low_stock)
Portfolio Output Create:
Retail Inventory Analysis Report with:
Fast-moving products
Low-stock products
Category performance
Inventory value
Restocking recommendations
This project demonstrates how Python analytics can support inventory and operational decisions.
What Should Every Python Data Analytics Project Include?
A common mistake beginners make is completing the code and stopping there.
A strong project should tell a complete story.
1. Business Problem
Start by explaining:
What problem are you trying to solve?
For example: The objective of this project is to identify which marketing channels generate the highest conversion and revenue.
2. Dataset
Explain:
Where the data came from
Number of rows
Number of columns
Important fields
Time period
Data type
For practice datasets, platforms such as Kaggle can provide datasets that beginners can use for analysis.
3. Data Cleaning
Show how you handled:
Missing values
Duplicate records
Incorrect data types
Invalid values
Inconsistent text
Date formatting
Example:
df.drop_duplicates(inplace=True)
df["Date"] = pd.to_datetime(df["Date"])
4. Exploratory Data Analysis
This is where you investigate the dataset.
Use:
head()
info()
describe()
value_counts()
groupby()
Filtering
Sorting
For example:
print(df.describe())
Pandas provides built-in methods for descriptive statistics and grouping, making these useful starting points for exploratory analysis.
5. Data Visualization
Charts make your findings easier to understand.
Depending on the project, you can create:
Bar charts
Line charts
Pie charts
Histograms
Box plots
Scatter plots
Heatmaps
For example:
import matplotlib.pyplot as plt
df.groupby("Category")["Sales"].sum().plot(kind="bar")
plt.title("Sales by Category") plt.xlabel("Category") plt.ylabel("Sales") plt.show()
6. Business Insights
This is one of the most important parts.
Don't simply say:
Electronics had the highest sales.
Explain what the result means.
For example:
Electronics generated the highest sales during the analyzed period, suggesting that the category is a major revenue contributor. The business could evaluate inventory levels and marketing investment for this category.
The objective is to move from:
Data → Finding → Insight → Recommendation
If you are looking for more project ideas and beginner-friendly portfolio examples, check out our guide to Top Data Analyst Projects for Beginners (2026)
How to Turn a Python Project Into a Portfolio Project
A Python project becomes much stronger when it is presented professionally.
Your project should ideally include:
Project Title
Example: Customer Churn Analysis Using Python
Objective Explain the problem.
Dataset Explain the source and columns.
Tools Used
Python
Pandas
NumPy
Matplotlib
Seaborn
Jupyter Notebook
Data Cleaning Explain the preprocessing steps.
Analysis Show important calculations.
Visualizations Include relevant charts.
Key Findings List the most important insights.
Business Recommendations Explain what a company could do based on the findings.
Conclusion Summarize the project.
This structure makes the project much easier for another person to understand.
How Many Python Projects Should a Beginner Build?
You don't need dozens of projects.
A focused portfolio with 3–5 well-executed projects can be more useful than a large collection of unfinished notebooks.
Try to choose projects from different areas.
For example:
Project 1 – Sales Analytics Demonstrates business and revenue analysis.
Project 2 – Customer Churn Demonstrates customer analytics.
Project 3 – Marketing Analytics Demonstrates campaign performance analysis.
Project 4 – Financial Analysis Demonstrates numerical and time-based analysis.
Project 5 – Inventory Analytics Demonstrates operational analysis.
This gives your portfolio variety.
The existing Sadhvi Academy project guide also recommends focusing on a smaller set of projects, using real datasets and clearly explaining insights rather than simply collecting project titles.
Where Can Beginners Find Datasets for Python Projects?
Beginners need datasets that are large enough to provide useful insights but simple enough to understand.
You can practice with:
Kaggle datasets
Public datasets
Government datasets
Open business datasets
Sample CSV files
Self-created datasets
For example, you could create a small sales dataset yourself using Excel, export it as CSV and then analyze it using Pandas.
Pandas supports common data sources including CSV, Excel, SQL and JSON, making it suitable for practicing different types of tabular data workflows. Beginners can explore real-world datasets on Kaggle Datasets, which provides datasets across areas such as business, finance, marketing, retail and more.
Python Project Workflow for Beginners
A simple workflow to follow is:
Step 1: Choose a Problem
Don't start with code. Start with a question.
Step 2: Find the Dataset
Choose data that can help answer the question.
Step 3: Import the Data
import pandas as pd
df = pd.read_csv("data.csv")
Step 4: Understand the Data
df.head()
df.info()
df.describe()
Step 5: Clean the Data
Handle missing values, duplicates and incorrect data types.
Step 6: Explore the Data
Use filtering, grouping and statistical calculations.
Step 7: Visualize Findings
Create charts that communicate the important patterns.
Step 8: Write Insights
Explain what the results mean.
Step 9: Give Recommendations
Connect your findings to the business problem.
Step 10: Document the Project
Create a professional project report or GitHub README.
Common Mistakes to Avoid in Python Data Analytics Projects
1. Choosing a Project That Is Too Complicated
Beginners sometimes choose projects involving advanced machine learning before understanding basic data analysis. Start with a clear business problem.
2. Focusing Only on Code
A Data Analytics project is not a coding competition. The goal is to understand the data and communicate insights.
3. Using Too Many Charts
More charts do not automatically make a project better. Use only visualizations that help answer your analytical questions.
4. Ignoring Data Cleaning
Real datasets often contain:
Missing values
Duplicates
Incorrect formats
Inconsistent categories
Cleaning should be documented as part of your project.
5. Not Explaining the Insights
A chart without an explanation is incomplete.
Always explain:
What happened? Why might it have happened? What should the business do?
6. Copying Projects Without Understanding Them
Using a tutorial is fine for learning, but your final portfolio should demonstrate your own understanding.
Try changing:
The dataset
The questions
The analysis
The visualizations
The business recommendations
How Python Projects Help Aspiring Data Analysts
Python projects can help students connect multiple Data Analytics skills.
For example:
Python + Pandas → Data cleaning and analysis
NumPy → Numerical calculations
Matplotlib / Seaborn → Data visualization
SQL → Database analysis
Power BI → Interactive dashboards
This creates a broader workflow.
For example:
SQL → Extract Data → Python → Clean & Analyze → Power BI → Build Dashboard
Students who want to understand how Python fits into the broader analytics toolkit can also exploreTop Data Analytics Tools Every Beginner Should Learn in 2026.
How to Combine Python With Power BI
Python analysis does not have to exist separately from dashboarding.
A beginner can:
Import raw data.
Clean the dataset using Python.
Perform exploratory analysis.
Identify important metrics.
Create visualizations.
Prepare the cleaned dataset.
Build an interactive Power BI dashboard.
Present the final business insights.
This gives you experience across multiple stages of the analytics workflow.
👉 You can also explore our Power BI Course Syllabus for Beginners (2026)to understand how Power BI fits into a broader Data Analytics learning path.
How Sadhvi Academy Helps Students Build Practical Python Skills
Learning Python becomes much more useful when students have opportunities to apply it through projects and practical exercises.
At Sadhvi Academy, students can develop Data Analytics skills through practical learning that combines Python with other analytics tools.
Students can work on areas such as:
Python programming
Pandas
Data cleaning
Data analysis
Data visualization
SQL
Excel
Power BI
Real-world projects
Business case studies
The August Python curriculum already emphasizes hands-on coding, real-world Python projects, capstone experience and integration with SQL, Excel and Power BI.
Students can also explore theData Analytics Course Syllabus for Beginners (2026) to understand the broader skills covered in a Data Analytics learning path.
Frequently Asked Questions (FAQ)
What are the best Python data analytics projects for beginners?
Beginners can start with projects such as marketing campaign analysis, customer churn analysis, expense analysis, product review analysis, website traffic analysis and retail inventory analysis.
Which Python libraries are used for Data Analytics projects?
Common libraries include Pandas, NumPy, Matplotlib and Seaborn. Pandas is particularly useful for working with tabular data, cleaning datasets, grouping information, reshaping data and performing analysis.
Can I build Data Analytics projects using only Python?
Yes. Beginners can complete many data analysis projects using Python libraries such as Pandas, NumPy, Matplotlib and Seaborn. Additional tools such as SQL and Power BI can then be added to create a broader analytics workflow.
Do Python projects help Data Analyst freshers?
Practical projects can help freshers demonstrate their ability to work with datasets, perform analysis and communicate insights. A well-documented project can also become part of a portfolio.
How many Python projects should I include in my portfolio?
A focused portfolio of around 3–5 well-documented projects can be a good starting point. Choose projects that demonstrate different analytical skills rather than creating many similar projects.
Where can I get datasets for Python projects?
Beginners can use public datasets, Kaggle datasets, government datasets, open datasets or create their own practice datasets.
Is Pandas necessary for Python Data Analytics?
Pandas is one of the most useful Python libraries for working with tabular data. It supports common tasks such as filtering, grouping, merging, cleaning and analyzing datasets.
Can I use Excel data in Python?
Yes. Pandas supports working with Excel files as well as CSV and other common data sources.
Should I learn Python before building Data Analytics projects?
You should understand basic Python concepts first, including variables, data types, conditions, loops, functions and basic data structures. After that, you can begin simple projects and learn additional concepts while working on them.
Can Python projects be added to a Data Analyst resume?
Yes. A well-executed Python project can be included in the projects section of a Data Analyst resume. Mention the problem, tools used, analysis performed and key outcome rather than only listing the project title.
Conclusion
Building Python data analytics projects is one of the best ways for beginners to move from learning Python concepts to applying them to real-world data problems.
Projects such as marketing campaign analysis, customer churn analysis, expense analysis, website traffic analysis, financial transaction analysis and inventory analysis allow students to practice important skills including Pandas, NumPy, data cleaning, exploratory analysis and visualization.
The most important part of a project is not how complicated the Python code looks.
It is whether you can:
Understand the problem → Analyze the data → Find meaningful insights → Explain the results → Recommend an action
Start with simple datasets, complete projects from beginning to end and gradually increase the complexity.
For aspiring Data Analysts, combining Python with Excel, SQL and Power BI can create a stronger practical analytics foundation.
At Sadhvi Academy, students can build these skills through practical learning, hands-on projects and industry-oriented Data Analytics training.
Click Here==> Click Here
Source / Website: Sadhvi Academy