Best Data Analytics course in coimbatore

Best Python Course in Coimbatore - Logo

Sadhvi Academy

Data Analytics Course Training in Coimbatore

Sadhvi Academy excels in providing the Best Data Analytics Course Training for students, designed to equip you with the skills and knowledge needed to succeed in the field of Data Analysis. Our program covers essential topics such as Python Programming, MS Excel, SQL, Power BI, and Tableau. By learning Data Analytics, you can also pave the way to becoming a Business Analyst. Our experienced instructors will guide you through hands-on projects and real-world case studies, allowing you to apply your new skills in a practical setting.

With both Offline and Online classes available, our program offers flexible scheduling to fit your busy lifestyle. Experience top-tier Data Analytics training in Coimbatore and take the first step toward a bright future in Data Analytics Certification. Enroll now to become a Data Analyst!

Key Features
Top Software Training Institute in Coimbatore

Gain In Demand Skills

Certified Trainers

Hands-on data science with python training

Hands-On Learning

Explore machine learning with python

Placement Assistance

offline classes near you

Industry Aligned Curriculum

top offline training in Coimbatore

Flexible Learning Options

Certification Course - Data Science Course

Supportive Learning Environment

Affordable
Fees

Why Data Analytics Course in Coimbatore at Sadhvi Academy?

The Best Data Analytics Course in Coimbatore at Sadhvi Academy offers an unparalleled learning experience, combining a comprehensive curriculum with hands-on practical application. Our industry-expert instructors provide exceptional teaching in an extraordinary classroom atmosphere, ensuring that students not only gain in-depth knowledge but also develop the practical skills needed to excel in real-world scenarios.

At Sadhvi Academy, we prioritize your career upliftment by offering personalized guidance and support, helping you transition smoothly into the data-driven industry. Our focus on practical skills and industry relevance ensures that you are well-prepared to make impactful, data-driven decisions in your career. Join Sadhvi Academy and benefit from an enriching learning environment that equips you with the expertise to thrive in the evolving field of Data AnalyticsExperience the difference of learning at Sadhvi Academy, where your success is our priority. Enroll now to start your journey toward a successful career in Data Analytics!

Understanding Data Analytics

Data Analytics involves the systematic examination and interpretation of raw data to extract valuable insights and inform decision-making. Using various techniques such as Statistical Analysis, Data Mining, and Visualization, Data Analytics transforms complex datasets into actionable information. It plays a crucial role in identifying trends, patterns, and correlations, enabling businesses and organizations to make informed choices, optimize processes, and gain a competitive edge in today’s data-driven landscape.


Who Should Opt For This Course?

  • College Final Year Students: Computer Science or related discipline students in their final year of college
  • Career Changers: Professionals looking to switch careers to data analytics and individuals who want to upskill
  • Job Seekers: Individuals actively seeking employment in the tech industry.
  • Domain Switchers: Professionals looking to switch from a different domain to data analytics
  • Freelancers: Independent freelancers in the field of data analytics and professionals transitioning to freelancing with a focus on data analytics to seek new projects and clients
Build web applications with django

COURSE SYLLABUS

  • Introduction to Python
  • Operators
  • String, List and Tuple
  • Set and Dictionary
  • Conditional statements and loops
  • Functions in Python
  • OOPs
  • Polymorphism and Encapsulation
  • Exception Handling, File Handling and Debugging
  • Modules & Packages
  • Regular Expressions
  • Decorators and Generators
  • Comprehension in Python
  • Numpy
  • Pandas
  • Matplotlibrary
  • Seaborn
  • Scikitlearn
  • Introduction to Statistics & Probability Concepts
  • Probability distributions
  • Statistical Inference - Estimation
  • Statistical Inference - Hypothesis Testing
  • Correlation and Regression Analysis
  • Analysis of variance (ANOVA)

Introduction to MySQL and Relational Databases

  • Overview of Databases and Data Analytics
  • Introduction to MySQL and its role in data analytics
  • Understanding Relational Databases
  • Installation of MySQL
  • Basic MySQL command-line interface (CLI) commands
  • MySQL Data Types


Data Types, Table Creation, and CRUD Operations

  • CRUD Operations
  • Creating a Database and Tables
  • Primary Keys and Foreign Keys
  • Inserting Data into Tables
  • Retrieving Data using SELECT statement
  • Data Manipulation and Aggregation
  • Filtering Data using WHERE clause
  • Sorting Data using ORDER BY
  • Using Aggregate Functions (COUNT, SUM, AVG, MAX, MIN)
  • GROUP BY clause for grouping data
  • HAVING clause for filtering grouped data
  • Advanced SELECT statements
  • Combining multiple queries


Joins, Relationships, and Subqueries

  • Understanding Relationships in Databases
  • INNER JOIN, LEFT JOIN, RIGHT JOIN
  • Joining multiple tables
  • Aliases for Tables
  • Practical examples of using Joins
  • Understanding Subqueries
  • Using Subqueries in SELECT, WHERE, and FROM clauses


Advanced Queries and Functions

  • Working with string functions: CONCAT, LENGTH, UPPER, LOWER.
  • Date and time functions: DATE, TIME, TIMESTAMP.
  • Conditional statements: CASE WHEN.
  • Views
  • Stored procedures and Functions


Database Design, Normalization, and Advanced Functions

  • Introduction to database design principles
  • Understanding normalization and its importance
  • Exploring different normalization forms (1NF, 2NF, 3NF)


Data Analysis and Optimization

  • Introduction to Data Analysis in MySQL
  • Generating Reports with GROUP BY and Aggregate Functions
  • Exporting Data to CSV or other formats
  • Understanding indexes and their role in query performance
  • Creating and managing indexes
  • EXPLAIN statement: Analyzing query execution plans

Introduction to Excel Basics

  • Excel Interface: Cells, rows, columns.
  • Entering Data and Basic Formatting.
  • Saving and Opening Files.
  • Cell Referencing: Relative, Absolute, Mixed.
  • Inserting and Deleting Rows and Columns.


Excel Functions and Common Operations

  • Basic Functions: SUM, AVERAGE, COUNT, MIN, MAX.
  • COUNT, COUNTA, COUNTBLANK,
  • Advanced Mathematical Functions: PRODUCT, MOD, SQRT, and FACT.
  • Rounding Functions: ROUND, ROUNDUP, and ROUNDDOWN.
  • Handling Common Cell Errors.
  • Data Validation
  • Conditional and Number Formatting
  • Text to columns and Flash fill options
  • Find and Search: Locating and Replacing Data.
  • Paste Special: Copying with Formatting and Operations.


Text Functions and Formulas

  • Text Functions: LEFT, RIGHT, MID, LEN, CONCATENATE.
  • Text Manipulation: REPLACE and SUBSTITUTE.
  • Using TEXT and VALUE Functions.
  • Date and Time Functions: TODAY, NOW, DATE, TIME.
  • Using Logical Functions: IF, AND, OR, NOT, ISERROR, ISNUMBER, ISBLANK, ISTEXT.
  • SUMIFS Function, COUNTIFS, AVGIF, MAXIF and MINIF Functions.


Nested IF Statements for Complex Conditions.

  • Making Logical Decisions with IF Function.
  • Handling Errors with IFERROR Function.
  • Basic Statistical Functions: MEAN, MEDIAN, MODE, and STDEV.


Data Analysis and Visualization

  • Chart Types
  • Working with Pivot Tables


Advanced Techniques and Automation

  • Introduction to Macros: Recording and Running Macros.
  • Basic Introduction to VBA: Variables, Loops, Procedures.
  • Creating Interactive Dashboards using Advanced Excel Techniques.

Introduction to Power BI

  • Overview of Power BI and its applications
  • Installing Power BI Desktop.
  • Getting familiar with the Power BI interface.
  • Connecting to data sources (e.g., Excel).


Power BI Charts with Formatting

  • Basic Charts: Creating bar charts, line charts, and scatter plots.
  • Applying basic formatting to charts.
  • Using data labels and legends.
  • Introducing pie charts and donut charts.
  • Creating maps: Plotting geographical data on maps.
  • Using tables: Display Data in Tabular Format
  • Applying conditional formatting to highlight data.
  • Introduction to filters and slicers for interactive filtering.
  • Utilizing cards to display key metrics.
  • Waterfall charts, funnel charts, and combination charts.
  • Implementing scrollable visualizations for large datasets.
  • Tree maps


Advanced Visualizations

  • Creating info graphics: Using custom visuals and shapes.
  • Inserting objects like images and buttons.
  • Applying bookmark actions for interactive storytelling.
  • Implementing advanced analytics features
  • Constructing a complete report: Combining visualizations, text, and images.
  • Formatting and arranging elements for a polished report.


Power Query Functions

  • PQ Text Functions
  • PQ Date Functions
  • PQ Number Functions
  • File Handling Techniques in Power Query


Introduction to M Language Power Query

  • Appending Files and Tables in Power BI
  • Merging Tables in Power Query (Power BI)
  • Fill down and Fill up
  • Grouping
  • Transpose
  • Unpivot
  • Data Types in Power Query (Power BI)
  • Replace Errors and Values
  • Keep Rows and Remove Rows
  • Add, Remove, Goto Columns


DAX Expressions

  • Introduction to DAX (Data Analysis Expressions) language.
  • Measures, Calculated Columns and Calculated Tables
  • DAX Formulas


Power BI Data Modelling & Integration

  • Connecting to MySQL database.
  • Data normalization: Understanding 1NF, 2NF, and 3NF
  • Refreshing data in Power BI and scheduling automatic refresh.
  • Advanced Data Modelling
  • OLTP vs. OLAP: Online Transaction Processing vs. Online Analytical Processing.
  • Incorporating Python Scripts Advanced Analytics.


Power BI Publishing

  • Publishing to Power BI Service: Uploading reports to the cloud.

Introduction to Tableau

  • Overview of Tableau and its applications
  • Importance of data visualization
  • Installation of Tableau
  • Introduction to the Tableau User Interface
  • Understanding Dimensions and Measures


Different Types of Plots and Charts

  • Introduction to various plot types
  • Understanding different Charts types in Tableau


Filters & Data Manipulation in Tableau

  • Default Properties of Fields
  • Context Filter
  • Extract Filter
  • Data Source Filter
  • Dimension Filter
  • Measure Filter


Applying Analytics to Tableau

  • Understanding Calculated Fields
  • Number Function
  • Aggregating Functions
  • String Functions
  • Table Calculation Functions
  • Date Functions
  • Introduction to Sets
  • Working with Parameters
  • Creating Groups in Tableau
  • Creating Bins and Histograms


Advanced Analytics in Tableau

  • Implementing the Sort Function
  • Adding Reference Lines and Trend Lines
  • Quick Table Calculations
  • Building a Pareto Chart and Waterfall Chart
  • Tableau Geographic Mapping
  • Tableau Dashboards
  • Purpose of Dashboards
  • Adding Objects to Dashboards
  • Applying Filters in Dashboards
  • Advanced Dashboard Features
  • Configuring Actions in Dashboards
  • Designing Dashboards for Mobile
  • Creating a Story in Tableau


Working with Multiple Data Sources

  • Understanding Union in Tableau
  • Exploring Joins in Tableau
  • Data Blending
  • LOD Expressions


Introduction to Level of Detail (LOD)

  • Fixed LOD
  • Include LOD
  • Exclude LOD
  • Time Series Analysis in Tableau
Program Fees

BASIC PROGRAM

⏳ 60hrs - 90hrs
  • 1-to-1 Mode Class Training
  • You will get a strong understanding of Fundamental Concepts
  • Core Practical Training and Project Guidance Support with Latest Projects
  • Daily Quiz & Assessments

ADVANCE PROGRAM

⏳ 120hrs - 180hrs
  • 1-to-1 Mode class Training
  • Training sessions are Facilitates with Latest & Advanced Technology Concepts
  • Industrial Projects + Job Preparation Training + Workplace Management + Communication Training
  • Placement Assistance
Data Analytics Job Outlook

Demand

The rising demand for proficient Data Analysts underscores businesses urgency to convert data into actionable insights. This emphasizes the critical role and increasing need for skilled data professionals in today's competitive landscape, driving innovation and strategic decision making across industries.

Future Scope

The demand for Data Analysts is on the rise because of the huge amount of data being generated and stored. With more companies using cloud computing and advanced data tools, the role of data analysts is becoming even more crucial and promising for the future. This means there will be many opportunities for data analysts as technology evolves.

Industry Growth

The global big Data Analytics market is projected to reach a staggering $312 billion by 2026, showcasing the significant growth potential in data-related fields. Data analysts, who play a crucial role in extracting meaningful insights from data, are poised to thrive within this expanding market, opening doors for numerous career opportunities.

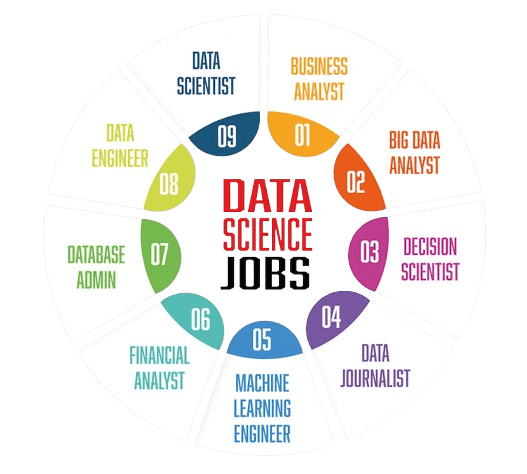
Job Opportunities
Frequently Asked Questions (FAQ)
  • No, learning Data Analytics is approachable, catering to various experience levels, including beginners.

  • Data Analytics empowers professionals to derive valuable insights from data, enabling informed decision-making across industries.

  • Yes, fresher can secure jobs in Data Analytics as the demand for skilled professionals is continuously growing.

No specific prerequisites. The course accommodates learners with varying levels of experience.

For Advance Course enrollees, Sadhvi Academy provides comprehensive job placement support, including counseling, resume help, mock interviews, networking, and assistance with potential employers.

Yes, upon successful completion, you get a certificate validating your proficiency in Data Analytics.

Yes, you get lifetime access to course materials for ongoing learning.

Certainly! The training includes hands-on projects for practical application of skills and building a portfolio in Data Analytics.

Inspiring education starts here Contact Us

Get ready to explore the realms of Best Data Analytics expertise. Reach out to us and let’s launch your extraordinary journey into the realm of Data Analyst market.

Sadhvi Academy in Coimbatore near Thudiyalur
Scroll to Top